RLocusGui
A Tool for Learning to Sketch Root Locus Plots
RLocusGui is a
graphical user interface written in the Matlab® programming language. It
takes a transfer function and applies the standard rules for sketching a root
locus plot by hand. Of course, Matlab can do this more accurately, but it
is important to know how pole and zero locations affect the final plot. It
is hoped that the RLocusGui program will be a versatile program for teaching and learning the construction of
root locus diagrams.
Files for the program
are found on github.
I have largely stopped updating RLocusGUI and have instead implemented the functionality in a web page at https://lpsa.swarthmore.edu/Root_Locus/RLDraw.html.
Invoking the program.
A Simple Example.
Consider the transfer function:

This function consists of a zero at s=-3, and poles at s=0, -1, and -2±2j.
We can define the system, and invoke the GUI.
>> mySys=tf([1 3],poly([0 -2+2j -2-2j -1]))  %define Xfer function
Transfer function:
          s + 3
----------------------------------------
s^4 + 5 s^3 + 12 s^2 + 8 s

>> RLocusGui(mySys)               %Invoke GUI
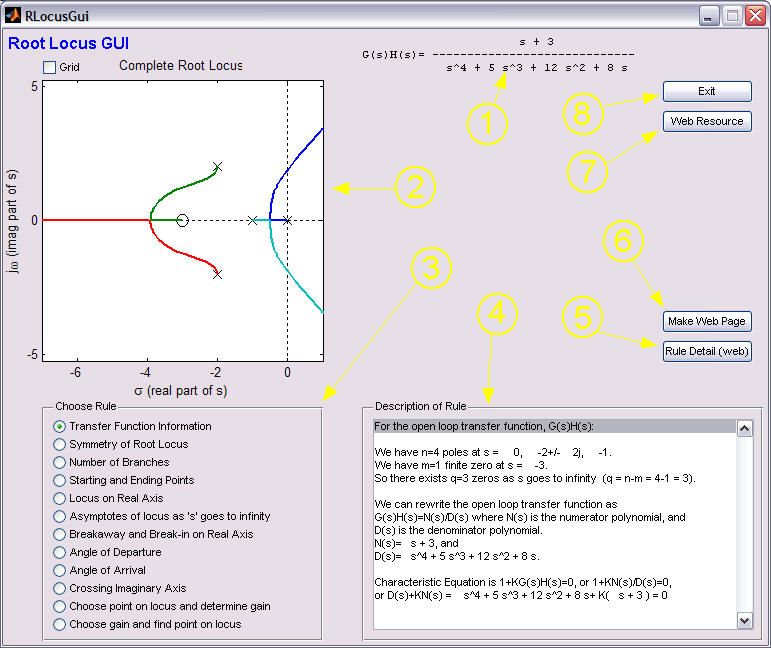
The GUI generates a window as shown
below.

Starting in the upper right and going
counterclockwise, the window shows:
-
The transfer function.
-
The completed Root Locus plot.
You could get the same root locus
plot from Matlab directly:
>>rlocus(mySys)
-
A set of radio buttons listing all of the root locus rules (see
below).
-
A text box that describes the application of the radio button
selected in (3): "Description of Rule."
-
A button, "Rule Detail (web)," that will open a web page describing
the selected rule in detail.
-
A button, "Make Web Page," that will generate a web page that
describes the application of the root locus rules to the chosen
transfer function (see below).
-
A button, "Web Resources," that links to
my files describing the root locus.
-
A button, "Exit," that closes the GUI.
Modifying what is
displayed
By selecting each of the radio buttons, you can change what is
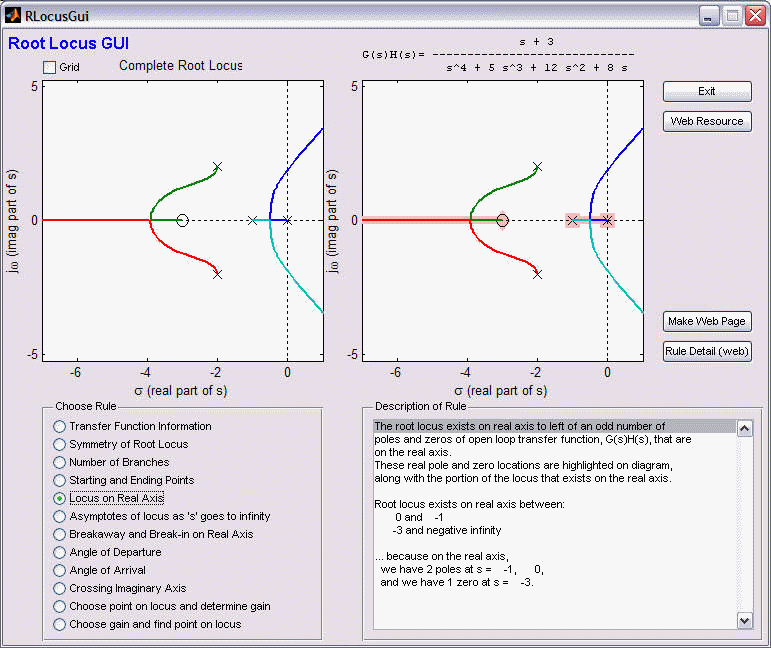
displayed. For example if you select the "Locus on Real Axis" radio
button, the display changes as shown below.

There are two notable differences in the figure.
First, the box in the lower right hand corner describes the application of the
selected rule. Even more noticeable is the second graph (at the right).
This graph shows the original root locus, and illustrates (graphically) the
application of the selected rule.
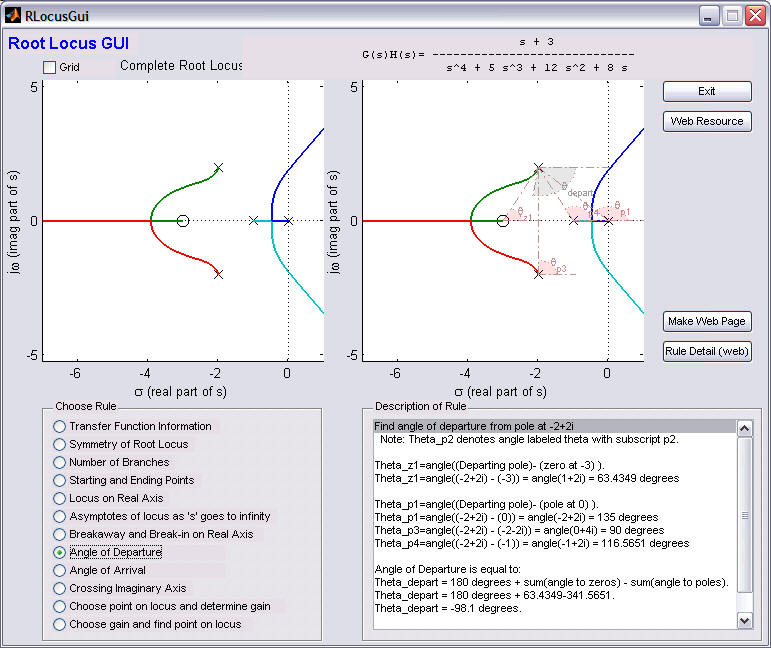
Any of the other rules may be chosen in turn. The calculation of
the "Angle of Departure" from the complex poles is illustrated below

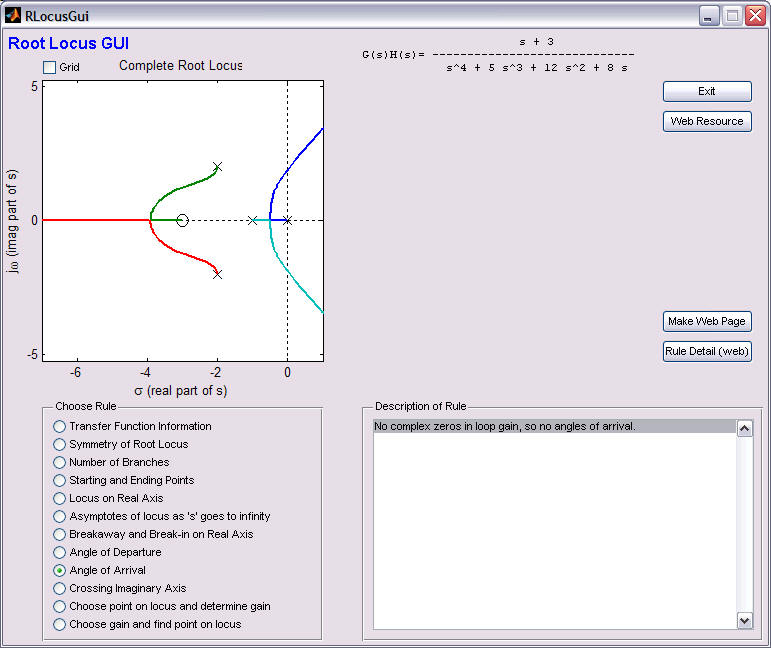
If the rule doesn't apply (e.g., "Angle of Arrival"), the "Description of
Rule" box states this, and there is no graphic (below)

The last two choices "Choose point of locus and determine gain" and "Choose
gain and find point on locus" are not really rules of the locus, but are instead
application (the former is more or less equivalent to the Matlab command "rlocfind", but describes how it would be done by hand). Both of them allow
further interaction and exploration (through a check box that appears above
"Description of Rule."
The program will also automatically generate a web page that displays all of
the rules and the graphics illustrating the rule. For example, if you hit
the "Make Web Page" button, each rule is invoked and a
web page is created and opened.
Note the web page and its associated files are created in the current Matlab
directory (i.e., the directory you see when you use Matlab's
"ls" command).
Limitations of the software:
Please let me know (links are below) if you find any problems with this
software, or have any suggestions.
→ Get the files →
References
Replace


