Note: I have stopped development of ConvolveGUI and have a similar JavaScript based demonstration at http://lpsa.swarthmore.edu/Convolution/CI.html.
ConvolvGUI is a MATLAB tool designed to help visualize the concepts behind the Convolution process. The purpose of this page is not to describe how convolution works (that is done elsewhere), but to show how to install and use ConvolveGUI. To install the code, download the code from github (https://github.com/echeever/ConvolveGUI), and save the files in the MATLAB path. See the README.md file on github for details.
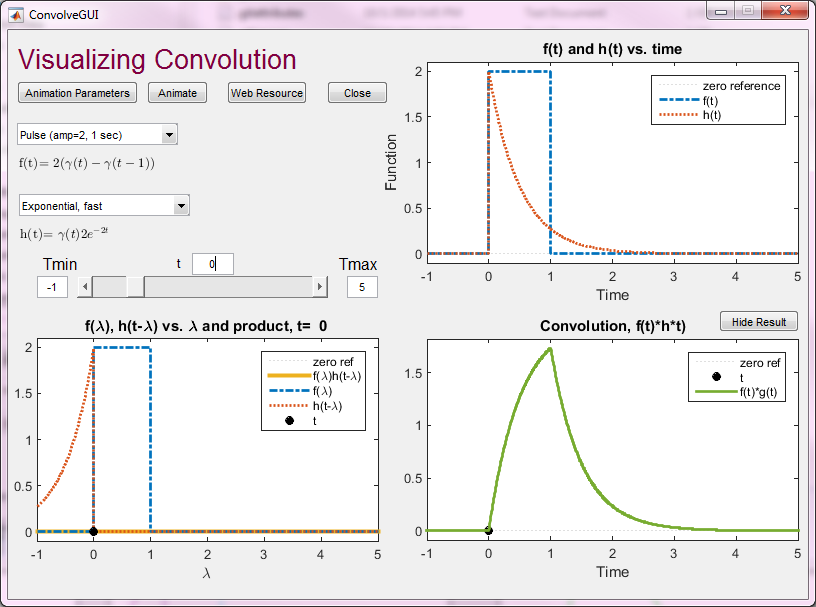
To run the code, enter the command "ConvolveGUI" at the MATLAB prompt. You will get a display similar to the one shown below.

The window shows the convolution of two signals, f(t) and h(t). The functions f(t) and h(t) are specified by the drop-down boxes in the upper left part of the window. The upper right set of axes shows the two functions. The lower left set of axes shows the functions f(λ), h(t-λ) and their product f(λ)h(t-λ) as a function of λ. The value of t is specified by the position of the slider above the graph (or by entering text into the box). The range of can be changed by entering text into the appropriate boxes. The convolution is shown on the graph on the lower right of the window. The specific value of t specified by the slider is shown as a black dot on both lower graphs..
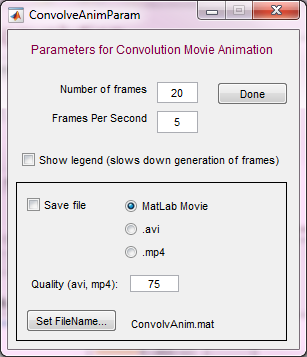
To animate the demonstration, hit the "Animate" button. The number of frames and speed of the demonstration are specified by hitting the "Animation Parameters" button. There are also options to create a movie from the animation - set the options, check the save box, and then rerun the animation.

If you would like to add functions to the drop down menus you need to edit the file "ConvolveFuncs.m" and run it. This stores a list of functions that are loaded by the ConvolveGUI function when it loads. The format of the function definitions is best explained by giving an example. The code below (taken from the ConvolveFuncs.m file) shows the definition of two functions, a rectangular pulse and an exponential that starts at t=0.
cFunc(1).f='U(t)-U(t-1)';               % Function to be executed
cFunc(end).n='Pulse (amp=1, 1 sec)';    % String for drop down menu
cFunc(end).d=[];            % Impulses nx2 (time, height) (see examples elsewhere in file)
cFunc(end).s='$\gamma(t)-\gamma(t-1)$'; % TeX string to be displayed.


cFunc(end+1).f='U(t).*exp(-t/2)/2';
cFunc(end).n='Exponential, slow';
cFunc(end).d=[];
cFunc(end).s='$\gamma(t)e^{-\frac{t}{2}}/2$';
The first line in each definition is a string that is evaluated to define the function. It must be proper MATLAB syntax. Note that I have defined the function U(t) in the ConvolveFuncs.m file such that U(t)=0 for t<0 and U(t)=1 for t≥0. The second line of the function definition is simply the string displayed in the ConvolveGUI drop down menus. The third line is the location of any impulses in the functions (see the ConvolveFuncs.m file for some examples), and the fourth line is a TeX definition of the file that will be displayed on the GUI. Write to me if you have trouble with this (see below for contact information).